Identify supply and demand dynamics & potential price movements
The NinjaTrader Order Flow Toolkit is based on the Wyckoff method and was developed by Gabriel Zenobi who is a Computer Scientist in applied mathematics, Data Science & Machine Learning, the toolkit was created for investment funds, banks and traders. It mainly focuses on all Futures markets and written in the programming language Microsoft C#.
Order flow tools in futures trading are designed to monitor and analyze the movement of orders within the market. These tools help traders gauge supply and demand, anticipate potential price movements, and identify areas where liquidity is concentrated. Particularly valuable for professional and institutional traders, these free tools offer insights into market sentiment and possible price trends by tracking the actions of major market participants.
To use these tools effectively, traders need a solid understanding of market mechanics and the ability to interpret the behavior of market participants. By analyzing order flow data, traders can gain an edge by identifying shifts in market sentiment and anticipating price movements before they become apparent on price charts.
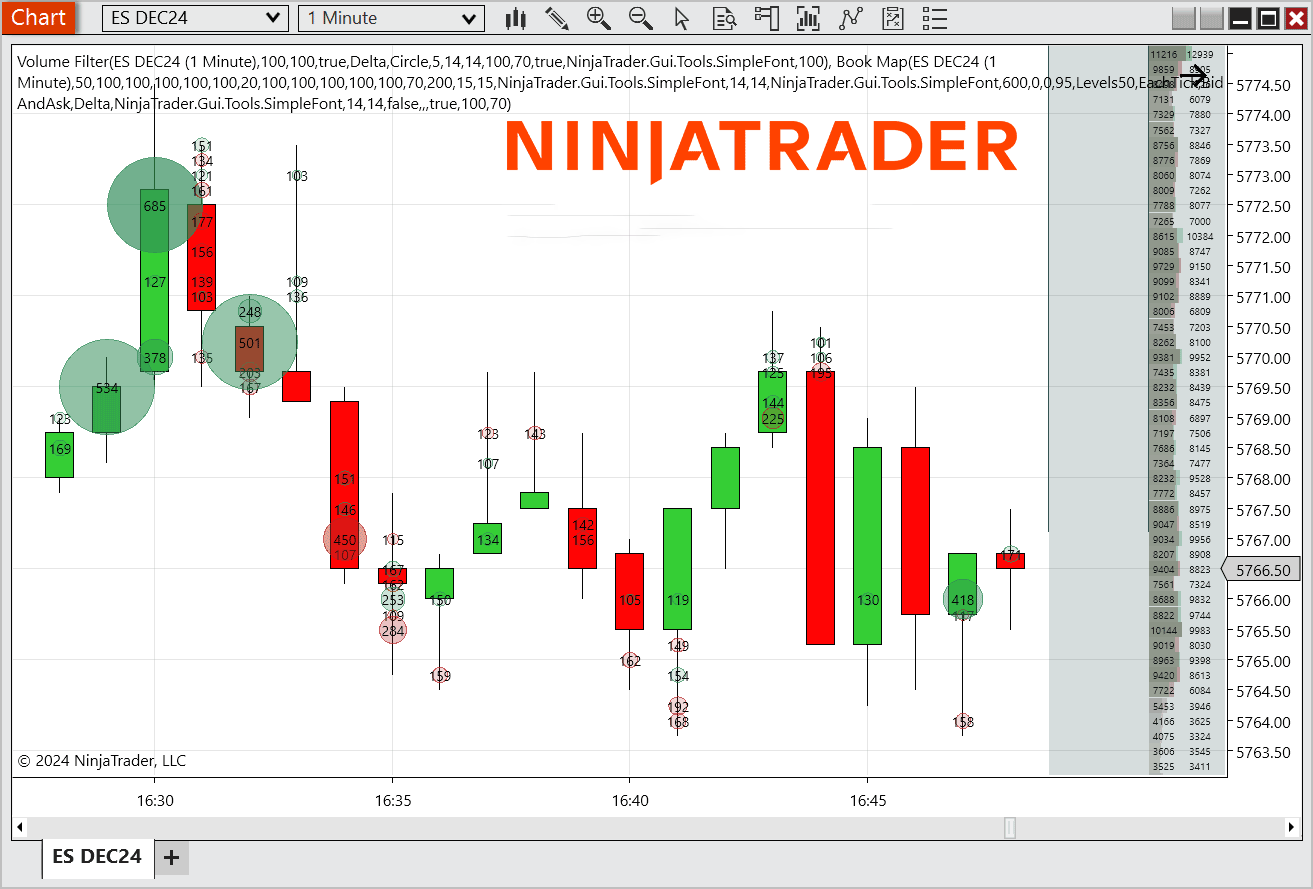
The NinjaTrader book map indicator shows the depth of the market (DOM or Level 2) using a heat map, which is useful for detecting capital injections, aggressive and passive orders, and aggressive volume levels. It also comes with an Order Book that shows the price distribution along with the total amount of volume in the market (both Total and Bid/Ask).
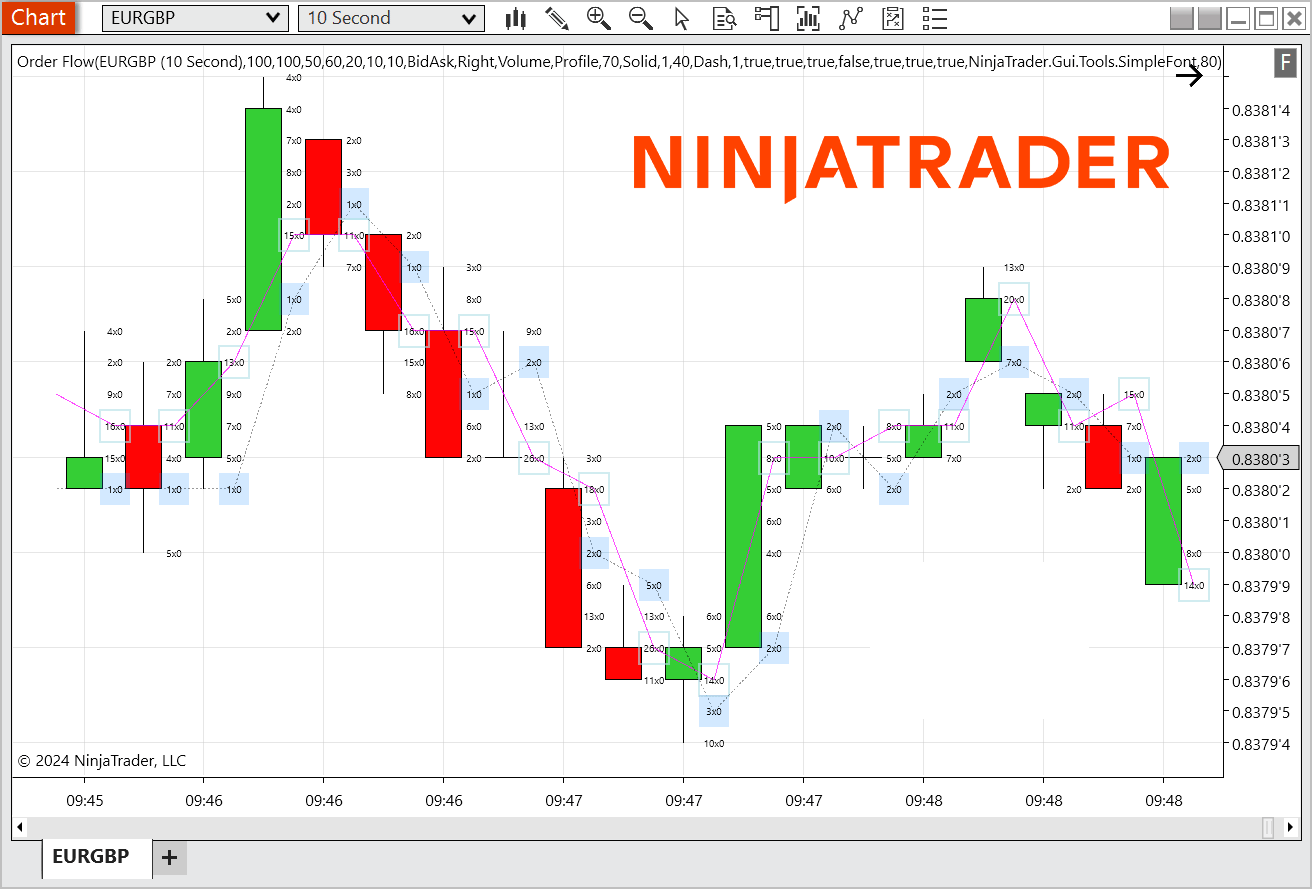
The NinjaTrader order flow indicator provides insight into the movement of orders within the market, highlighting the difference between supply and demand levels. Skilled traders can use this information to anticipate potential price imbalances, allowing them to exploit resistance points for placing orders. In essence, the order flow displays the number of contracts at each price level, which is why it is often referred to as a "Cluster Chart" or "Footprint."
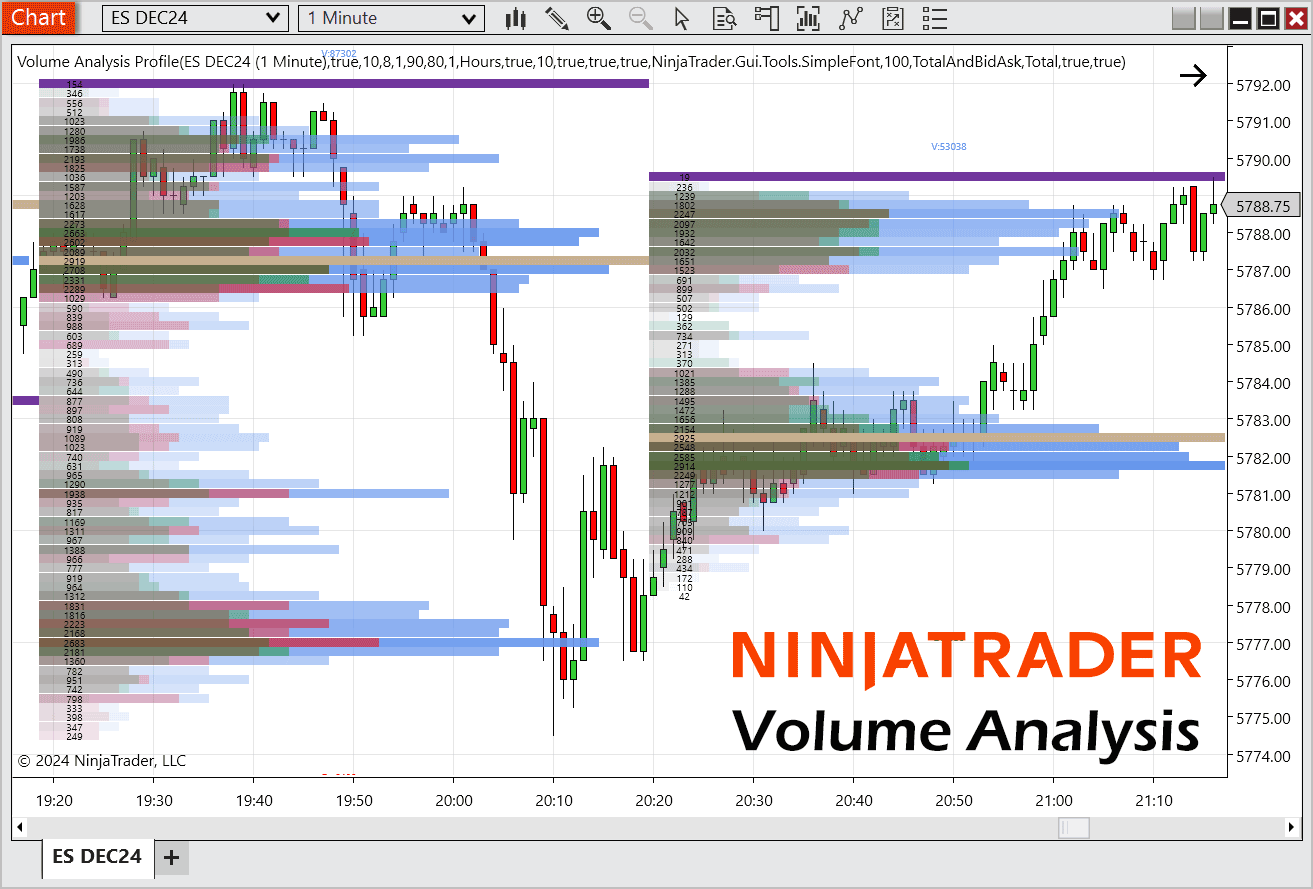
The NinjaTrader volume profile indicator displays the horizontal distribution of the number of contracts traded at each price level over a specified period. It also provides key data such as the Point of Control (POC), Point of Interest (POI), Delta volume, and Total Volume for the selected timeframe. A useful feature of this indicator is the ability to drag and drop, allowing users to select specific price zones to create custom volume profiles, which can be easily deleted when no longer needed.
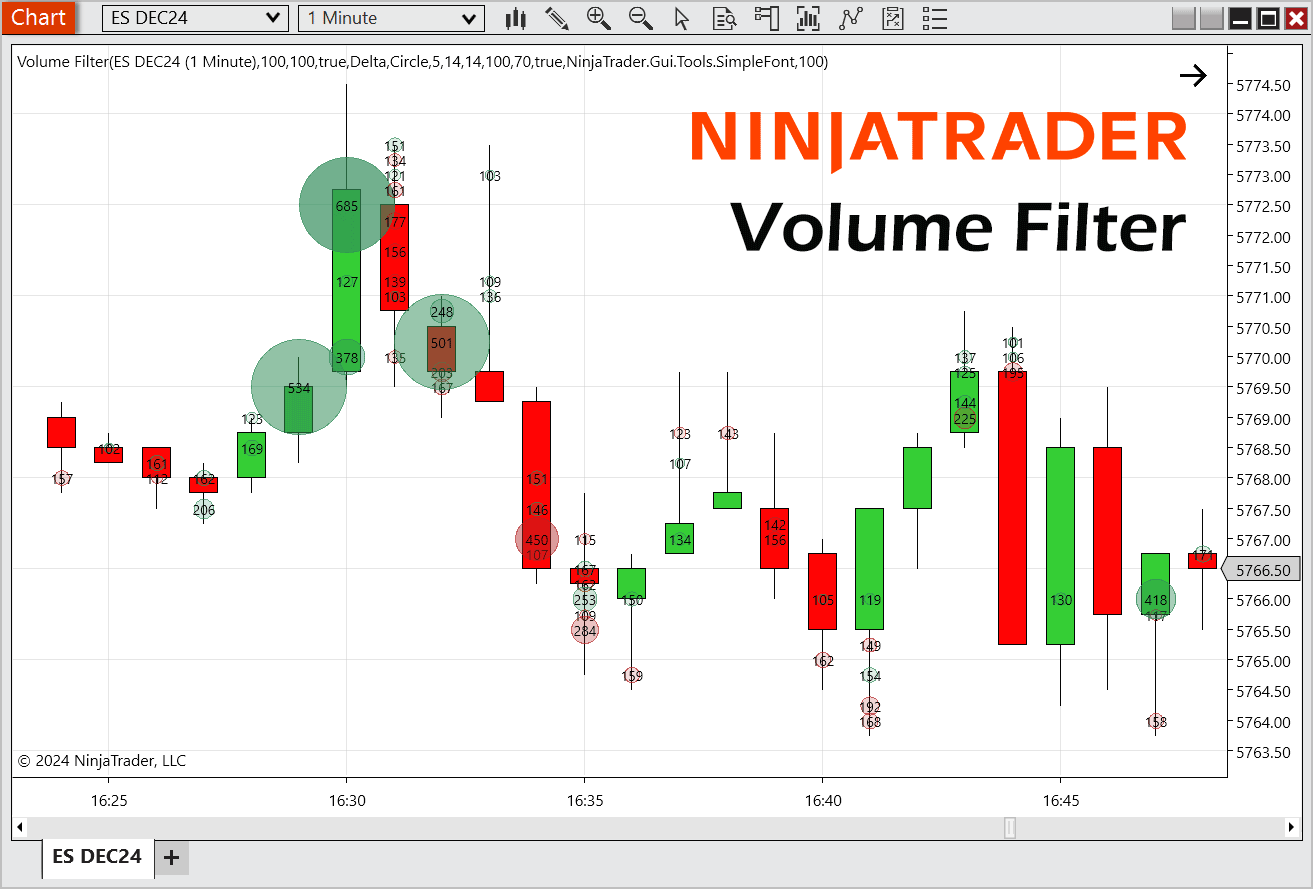
The NinjaTrader volume filter indicator is an essential tool for identifying key areas where significant volume indicates a battle between buyers and sellers. We may filter only a specific volume threshold, while other situations call for a comprehensive "map" of all incoming volume, from the smallest trades to the most aggressive. This indicator becomes especially powerful when used in conjunction with Book Map.
This is one of the simplest and most widely used volume analysis tools as it allows you to view the total Delta volume, accumulated volume, and other key metrics. One of its standout features is the ability to choose cumulative time frames, unlike most similar tools that only offer fixed periods. This flexibility allows users to set custom volume time frames as needed.
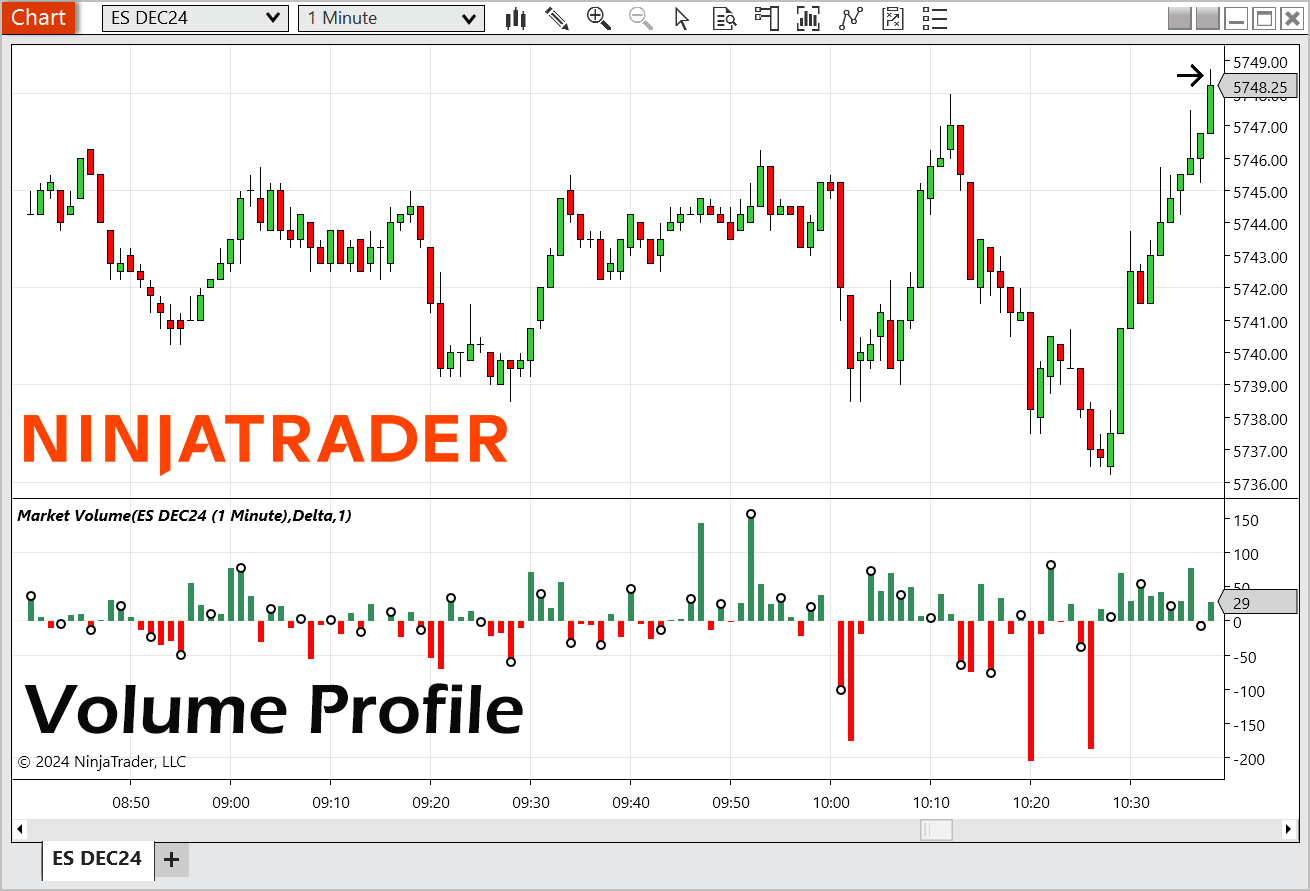
Download all 5 order flow indicators for the NinjaTrader platform.
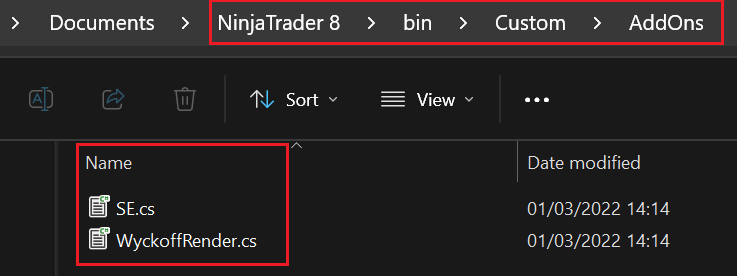
To install the order flow indicator toolkit, you will need to download the toolkit and unzip the file, in the folders you will see the 'Add-ons' and 'indicators', start by copy/pasting the add-on files into the NinjaTrader custom add-ons folder shown below.
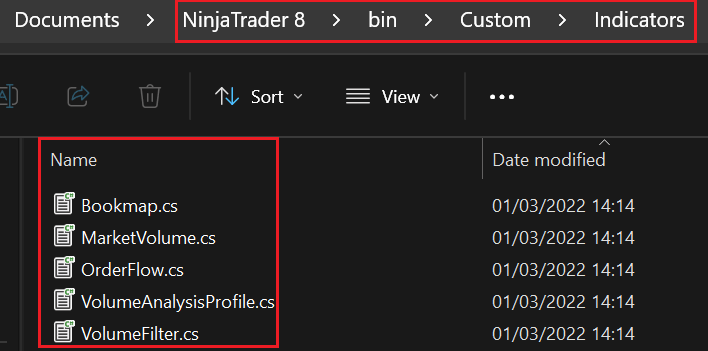
Next you will need to copy/paste the indicator files into the 'custom indicators' folder.
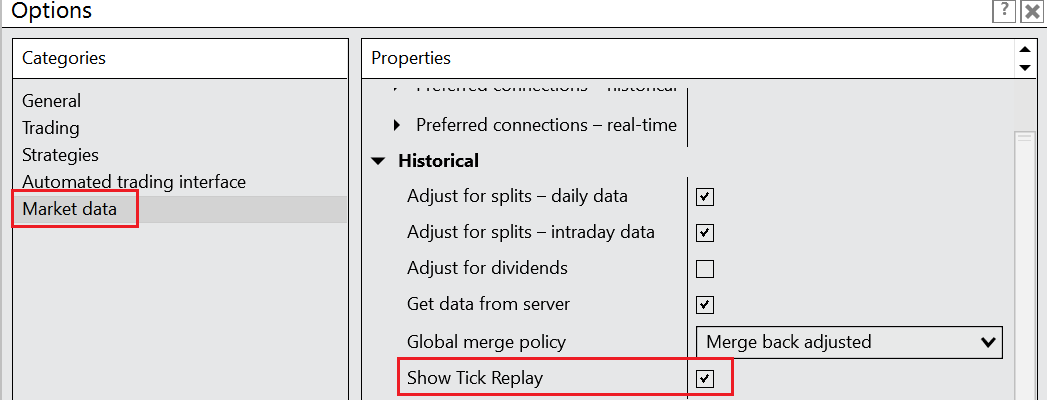
Finally, we need to activate "Tick Replay": Tools->Options->Market Data and activate "Show Tick Replay".
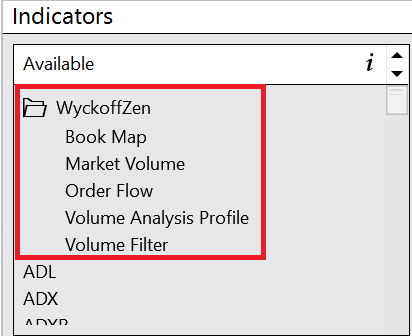
You may need to restart NinjaTrader for the indicators to show in the available indicator folder.
Any questions, please first try our support forum.